The IMPROVE data for S
The concentrations for S, with their high concentrations
and easy detectability, offer a wealth of information on sources of pollution
aerosol for the United States. The slide show for S reveals five major effects:
winter peaks, spring peaks, summer peaks, summer depletions, and transported
summer pulses. Each of these effects can be considered separately. Together they
make up the individual plots.
Let us begin with the spring peaks, which are seen in the
West. Then have the same timing as the peaks for Pb and Si, and presumably have
the same source—material transported from over
the Pacific. Like Pb, their concentrations are highly reproducible wherever the
peak is seen—0.2 to 0.4 µg m-3, which is 100 times greater than
the peaks of Pb. The peaks of S are harder to detect than those of Pb, however,
because background for S are higher. This restricts clear peaks to the places in
the United States with the absolute lowest backgrounds, which for both Pb and S
seems to be Idaho and vicinity. The low backgrounds and clear peaks that were
seen for Pb in Colorado are not seen for S.
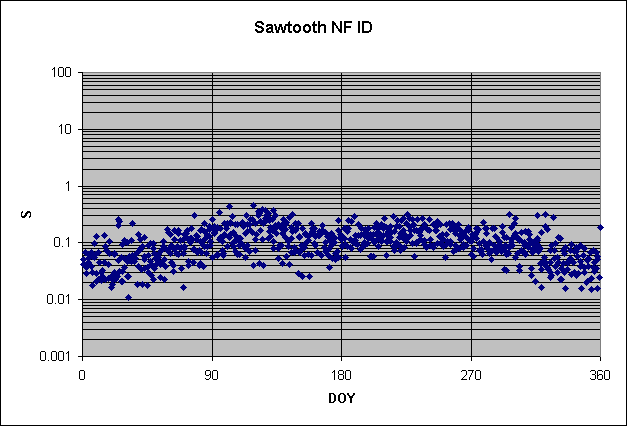
Here is one of the clearer spring peaks, for Sawtooth
National Forest, near the geometric center of Idaho.

Here is the same peak at Craters of the Moon National Monument, Idaho, just to the southeast of Sawtooth. Note how quickly the peak has become muddied by the higher and more irregular background.
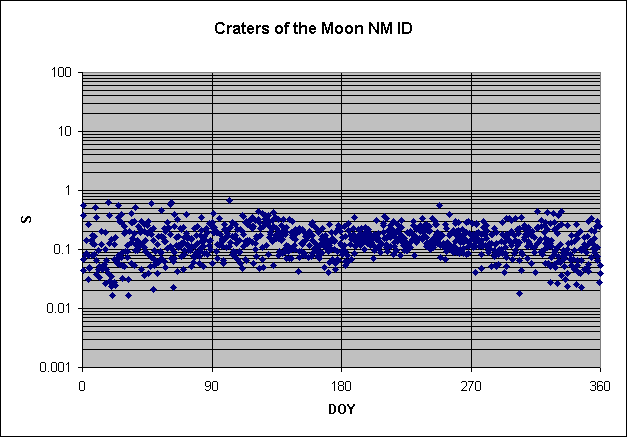
It is obviously the same thing, just less obvious. The
timing and the height are the same.
The spring peak can also be seen in parts of California, but
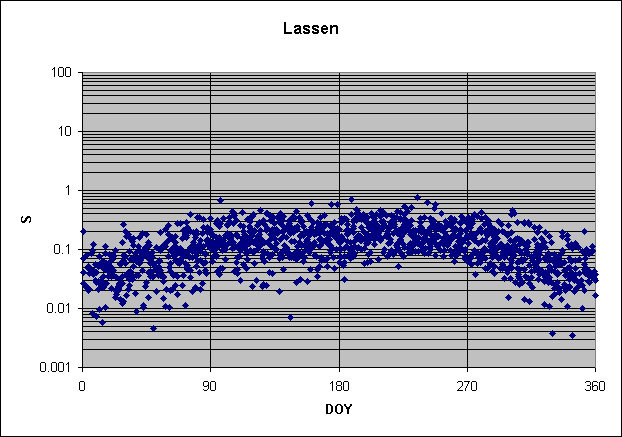
it is interfered with still more. Here is the plot for Lassen, in the northern
part of the state. The peak is present, but you have to look to find it. It can
be seen better by the increased minima than by the maxima.
The consistency of the spring peaks for Pb and S open the
door to deriving their mean concentrations and composition and then comparing
that with possible sources to see where it might have originated. We do that in
a later section.
Is the shape of the spring peak for S the same as the shape
for Pb? This question is not as easy to answer as it might appear. Although it
appears so on the plots, the higher background renders less of the peak visible.
Trying to examine the peaks upwind, in Hawaii, presents another problem because
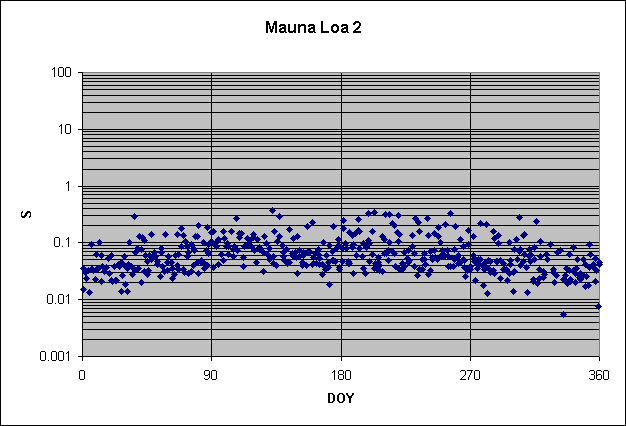
of the effect of elevation. Concentrations at Mauna Loa are only about half
those in North America, as they were for Pb, although a spring peak is seen with
the same general shape as in North America. It reaches 0.06-0.2 µg m-3.
Note the split during summer and into October, with a band of high
concentrations riding four times above the main zone.
(See the plot just below.)
But when the lower Haleakala is tried, a markedly noisier pattern is seen, and without the spring peak of Mauna Loa. The concentrations are right (about twice as high, or 0.1-0.4 µg m-3 or so), but the shape is wrong. (See the plot below.)
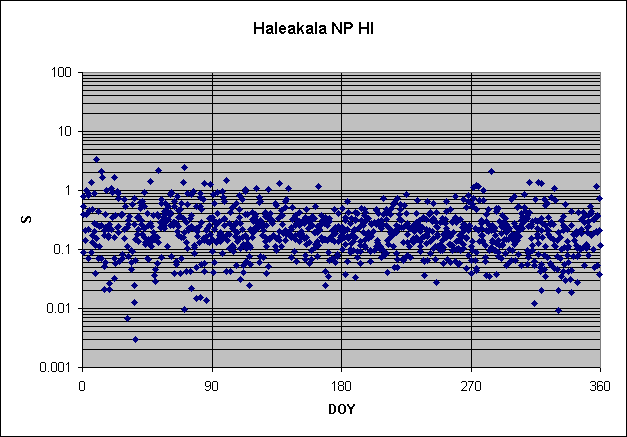
I suspect but cannot yet prove that the lower elevation of
Haleakala is interfered with by local sources, perhaps even at the sea surface.
The best we can presently do is to assume the shape from
Mauna Loa and the higher concentrations from spring at Haleakala. That allows us
to speak of a spring peak over the Pacific that agrees in size and shape with
that found in western North America. In other words, the S appears to be
transported just like the Pb.
Next we consider the summer peak. It gives every evidence of
being photochemical and pollution derived. It is much broader than the spring
peak, typically lasting from May or June through September. It has a very
interesting and unusual geographical distribution. Moving south from Washington
through California along the Cascades and the Sierra Nevadas, we first encounter
high concentrations in Washington of 1 µg m-3,
presumably showing the influence of greater Seattle. By central Oregon (Three
Sisters), the concentrations have declined by a factor of two, and by southern
Oregon (Crater Lake) they are down to 0.3 µg m-3. Into northern
California and to the south, they increase progressively to a maximum of 1 µg m-3
at Sequoia National Park and south. Throughout the rest of the Rockies the
concentrations are lower, averaging about 0.4–0.5 µg m-3, in the
south and 0.2–0.3 µg m-3, in the north. Summer concentrations east
of the Rockies are much higher, more like 3–6 µg m-3. Here is a
typical plot for the East, from Mammoth Cave NP, Kentucky.
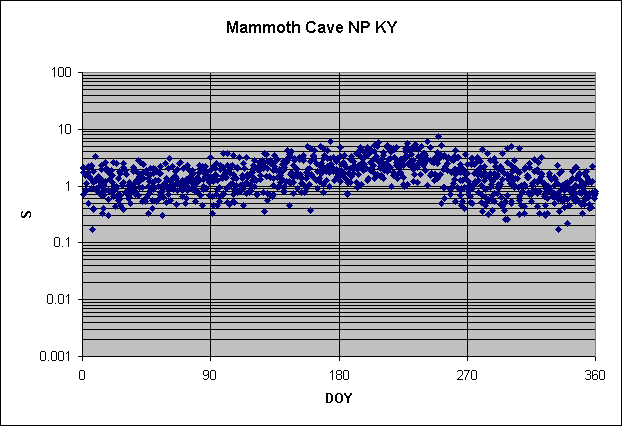
One very interesting feature of the high summer
concentrations in the East is their subset of unusually high values. They
represent periods of stagnated air, associated with the Bermuda high-pressure
area, in which secondary sulfate accumulates for a few days. When a low
approaches form the west, this material is transported to the northeast, where
it enters areas that are normally much cleaner. The result is pulses, or
"episodes," of sulfate. These plots show that they appear from June
through September and typically peak in late July and early August. In the
cleaner locations of the Northeast the set of episodes produces a split in the S
concentrations that can be pronounces. An example is shown below, for Acadia
National Park, Maine. The episodes average about 2 µg
m-3 S, while normal concentrations are closer to 0.5 µg
m-3 S.
Another type of split is caused by depressing the lower
concentrations rather than increasing the upper ones. The low values are
associated with cleaner Atlantic air impinging on the coast during summer, and
can be seen from Miami through Maine. The low values are about 0.1 to 0.3 µg
m-3, consistent with the 0.2 to 0.4 µg m-3 seen in
Atlantic air of the Virgin Islands.
The winter peak is also broad (from roughly November into
March, when the spring peak is superimposed on it), and appears to be associated
with southward transport of Arctic air. It is seen more clearly in the north
central states. An example is shown below, for Voyageurs, Minnesota. Note how a
March-April peak adds to the flat winter pattern just before the whole thing
collapses in late April and into May. A similar winter effect is seen across the border states all the way to Glacier NP in
northwestern Montana.
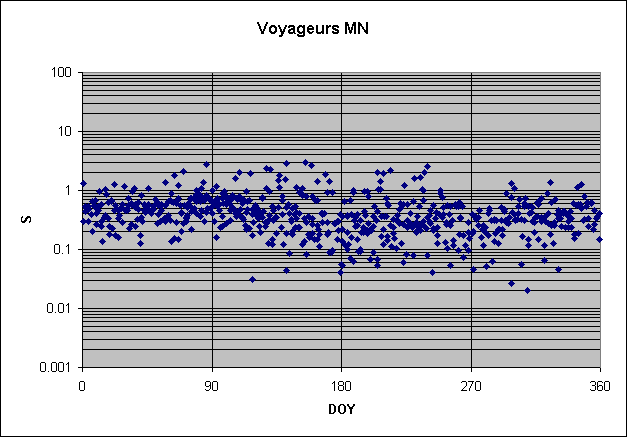
Depending on location, the winter peak can be 0.5 to 1 µg
m-3. This is consistent with extensive earlier measurements of S in
Arctic haze.
A very interesting question is whether the spring peak of the
type shown at Voyageurs is the same spring peak shown across the West (and shown
for sites in Idaho above). I think not, for it comes weeks before the western
peak. The peak at Voyageurs is also seen at other northern sites, and seems to
be more consistent with the Arctic pattern seen at Denali, which in turn is
consistent with the classical broad maximum of Arctic haze. Thus it is possible
that we have two spring peaks in the U.S., of very different origins.
In summary, S over the IMPROVE network shows a spring peak in
the West that appears to be the same Pacific material as seen for Pb, a summer
peak that is U-shaped, with maxima near the Pacific and Atlantic coasts, a
negative effect in the East from incursions of clean Atlantic air, pulses
transported from the mid-Atlantic states to the Northeast, and a winter plateau
and spring peak from Arctic sources. Quite a litany! Maximum concentrations
reaching the West from over the Pacific are a few tenths of a microgram per
cubic meter, and then only for a month or so. The winter plateau from the Arctic
is 50% higher.
Ahead to S vs. S at Mauna Loa
Back to Pb vs. Pb at Haleakala