HW 11 Chapter 10 CT#1
|
Time |
Nt |
1-(N/K) |
RNt(1-N/K) |
Nt+1 |
|
1 |
20 |
0.98 |
19.6 |
39.6 |
|
2 |
39.6 |
0.96 |
38.016 |
77.616 |
|
3 |
77.6 |
0.92 |
71.392 |
148.992 |
|
4 |
148.992 |
0.851008 |
126.793384 |
275.785384 |
|
5 |
275.785384 |
0.72421462 |
199.727806 |
475.51319 |
|
6 |
475.51319 |
0.52448681 |
249.400396 |
724.913586 |
|
7 |
724.913586 |
0.27508641 |
199.413879 |
924.327465 |
|
8 |
924.327465 |
0.07567254 |
69.9462026 |
994.273667 |
|
9 |
994.273667 |
0.00572633 |
5.69354169 |
999.967209 |
|
10 |
999.967209 |
3.2791E-05 |
0.03278981 |
999.999999 |

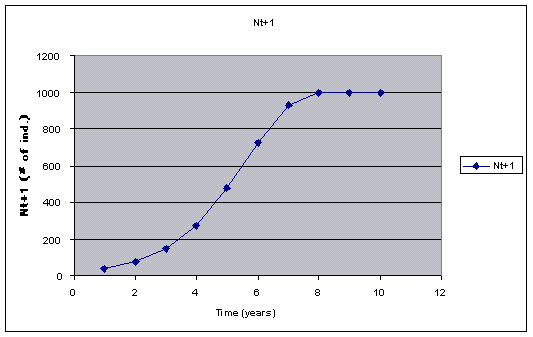
The above graph shows a logistic growth (or S) curve, which increases initially exponentially and then tapers off as it approaches the carry capacity (k+1000).
PART 2 (Extra Credit) Chaos
For a growth rate of 2, the graphs shows that exponential growth continues until the carrying capacity is exceeded. Then population fluctuates periodically (about every two years) around the carrying capacity.
|
|
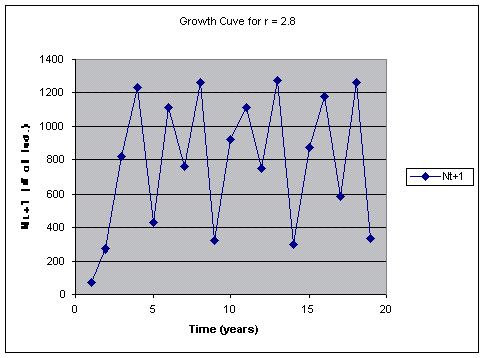
For a growth rate of 2.8, the graph shows exponential growth which is also limited by the carry capacity. However, in stead of fluctuating with a regular periodicity, the population fluctuates irregularly with a period of about 4 years.

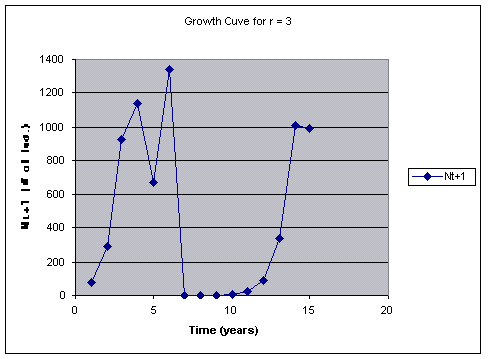
However, chaos does not occur until the growth is 3 or greater (the book is
wrong in implying that chaos occurs at 2.0 and2.8). Chaos then occurs and the
population fluctuates greatly. In the following case the population would have
gone extinct when it drop to 0.5 at around 7 years. Although it looks like random behavior in the population
occurs when r = or > 3, its behavior is nor random but has a non-linear
complexity. The population at one
point in time is dependent on the previous point in time in which slight changes
are amplified by feedbacks.
