Lab 4 Plate Tectonics
![]()
![]()
![]()
![]()
![]()
![]()

![]()
![]()
![]()
![]()
![]()
![]()
![]()
![]()
![]()
![]()
![]()
![]()
![]()
![]()
![]()
![]()
![]()
![]()
![]()
![]()
![]()
![]()
![]()
![]()
![]()
![]()
![]()
![]()
![]()
![]()
![]()
![]()
![]()
![]()
![]()
![]()
![]()
![]() Part
A.
Part
A.
![]()
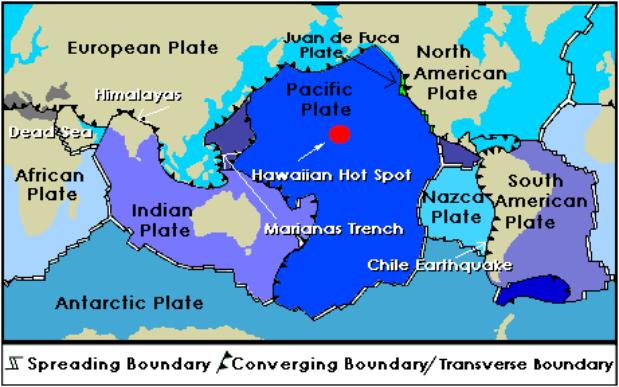
Represents Approximate Hot Spot Locations (not georeferenced –only 1 needed for assignment)
Arrows are also only guesstimates and do represent actual directions measured.
1. and 2. See above Arrow represent approximate plate movement directions. (transforms not shown)
3. Himalayas (maybe others)
4. Andes Mountains, Chile (western side of South America)
5. Marianas Trench and Hawaiian Hot Spot
6 a.) crust 15,000,000 mm (1m/1000 mm) (1km/1000 m) = 15 km
mantle 2,900,000 m (1 km/1000 m) = 2.9 * 10^3 km
core 3.5 10^8 cm (1m/100 cm) (1km/1000m) = 3.5 * 10^3 km
Part B.
5. See profiles.
6. Profile A 5 Ma, Profile B 15 Ma, Profile C either 9.5 or 10 Ma
7. A. 250 km/(5 *10^6 years) = 5 cm/year
B. 375 km/(15 *10^6 years) = 2.5 cm/yr
C. 240 km/ (10 *10^6 years) = 2.4 cm/yr or 240 km/ (9.5 *10^6 years) = 2.5 cm/yr
8. There are a variety of acceptable answers for this one as there are multiple reasons why spreading rates differ. One might be the proximity of a hotspot to the ridge. A hotspot may increase the rate of spreading. Another is the type of boundaries of the plate. A subduction zone on one side might exert a pull on the plate in that direction. As the ocean crust cools and ages it becomes denser and has a tendency to sink due to gravity. At the midoceanic ridges where new crust forms a push force is generated by the high topography of the midocean ridge on the rest of the plate. Changes in underlying mantle convection rates might also affect spreading rates of the plates. Also whether the boundaries are continent-continent, oceanic-continent, or oceanic-oceanic impact the the movement of the plates.
Part C.
9. a) your numbers might vary somewhat, but should be in the general range of the following:
113 mm * (1000 km/47 mm) = 2404 km or 2.4 10^3 km
b) 2.4 10^3 km/ (20 *10^6 year) * (1000 m/km) * (100 cm/ m) = 12 cm/year
c) Northwest
d) The plate changed directions from north to northwest.