The IMPROVE data on Ca/Si
Recall that the reason for examining the Ca/Si ratio was
to check further on whether the crustal aerosol appearing in the West was really
from over the Pacific. This was in addition to the test of equal concentrations.
First you check to see whether the concentrations of Si at a site in the West
were sufficiently similar to those in Hawaii. If they exceed the Hawaiian
values by too-large a factor (something around two), then transport over the
Pacific could be eliminated as a source. (Recall that this first test seemed to
eliminate the Si of summer and fall throughout the West.) If the concentrations
were close enough to Hawaiian values, transport remained in contention, and the
test of the Ca/Si ratio of was then applied, with the same logic. If the ratio fell out of the range of Hawaiian
values, then
the aerosol could not have come from over the Pacific. If the ratio was close
enough to Hawaiian, transport remained in contention. Note that these
tests cannot prove that the Si came from over the Pacific, only that it could
have.
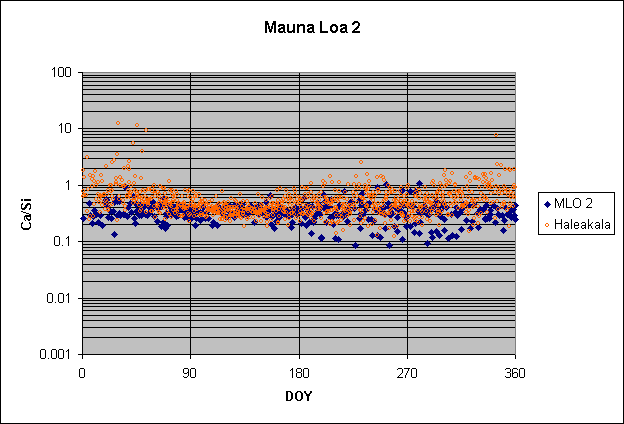
What do the Ca/Si ratios show about Si in western North
America? We first must establish the range of the Ca/Si ratio at Hawaii in winter and
spring. The plot below shows the ratios for Mauna Loa 2 and Haleakala throughout
the year. Mauna Loa is the more consistent of the two, and has ratios generally
between 0.25 and 0.45 throughout the winter, spring, and part of the summer.
Haleakala has the same values during the spring peak, but higher values during
the rest of the year. It is easy to show that the higher values are an effect of
marine aerosol reaching the lower Haleakala site. Thus we disregard these values
and take the common range of 0.25 to 0.45 as our reference for Ca/Si coming from
the Pacific.

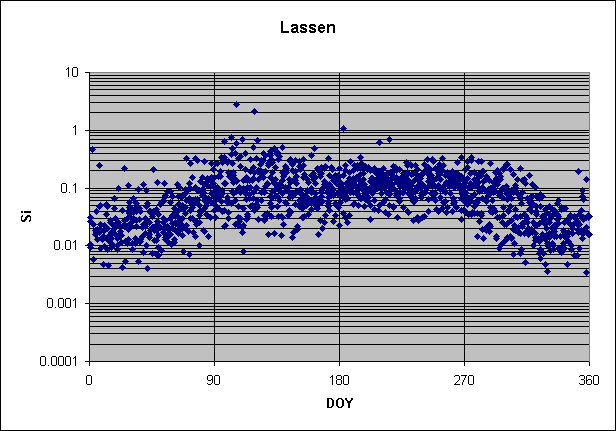
Next we examine the Ca/Si ratios in western North America during winter and the build-up to the spring maximum, the times when so many concentrations of Si matched Hawaiian values, i.e., passed the first test. Here we must be very careful, for small changes in ratio mean a lot. We find that many sites in the West have similar plots, exemplified in the figure below by Lassen, CA (whose concentrations of Si shown above matched Hawaiian values during winter and early spring). We include the plot for Si for reference.
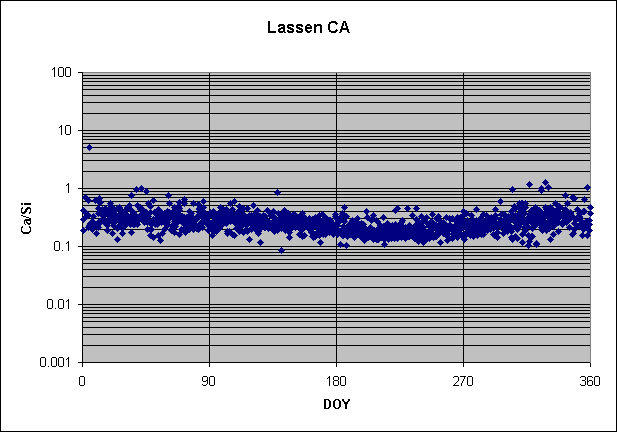
The plot of Ca/Si has two obvious features, higher ratios during winter
and early spring and lower ratios in summer. The low ratios of summer correspond
in time to the high concentrations then, and jointly mean that the bulk of summer Si
has not come from over the Pacific. (In other words, the ratio test gives the
same answer as the concentration test.) The higher values during winter and
spring (and fall, too, in this case) keep the Pacific source in contention for
these seasons.
But a closer look at the figures shows that the Ca/Si ratio
begins to decrease well before summer is reached. In fact, it can be seen
starting downwards as early as May, which is just when Lassen's spring peak
begins to decline. That reinforces the impression from the Si plot that local Si
at Lassen is appearing in force by the end of the spring peak. It takes until
July for this source to fully establish itself over the transported Si, however,
via a combination of the local source strengthening and the transport weakening.
This detailed analysis shows the full power of the graphical approach. Of
course, none of this would be possible without the large number of samples made
available by the IMPROVE network.
I urge the interested reader to go carefully through the
slide show for Ca/Si and see how many of the western sites have patterns similar
to Lassen. You will find that most sites in the first two tiers of states do.
Farther east, exceptions to the patterns begin to appear, usually with higher
Ca/Si ratios in seasons other than spring. Notable examples include all the
sites in Utah and Great Basin, Nevada, which is on the boundary with Utah. The
highest systematic ratios of all are found in Lone Peak Wilderness, Utah, on the
southern border of the Great Salt Lake. Farther east and south (into Colorado,
New Mexico, and Arizona) the patterns return to normal.
Higher Ca/Si ratios during nonspring are also shown by sites
along the West Coast, and are caused by their high marine aerosol. High
nonspring ratios are also found throughout the upper Midwest (Montana, the
Dakotas, Minnesota, etc.); their cause is still unclear (to me, at least). At
least in the winter, they may be linked to the Arctic aerosol found there, which
in Denali has elevated Ca from the marine component. Higher nonspring Ca/Si also
seems to be the rule throughout much of the East. Although I don't know its
sources, wood-burning cannot be excluded.
The Ca/Si ratio also provides a sensitive test for Saharan
aerosol, in some ways even more sensitive than the concentrations of Si. Just as
Si showed a summer pulse in Texas that increased toward Louisiana and Florida,
the Ca/Si ratio shows a negative pulse at the same time. This pulse is not to be
confused with the lower summer ratios found in sites farther north, for the
former comes on much more abruptly about the first of July and increases
strongly toward Florida. An example, for Big Bend, Texas, is shown below. Note
how it contrasts with the more gradual decline seen in the plot for Lassen
above. The two summer minima are very different.
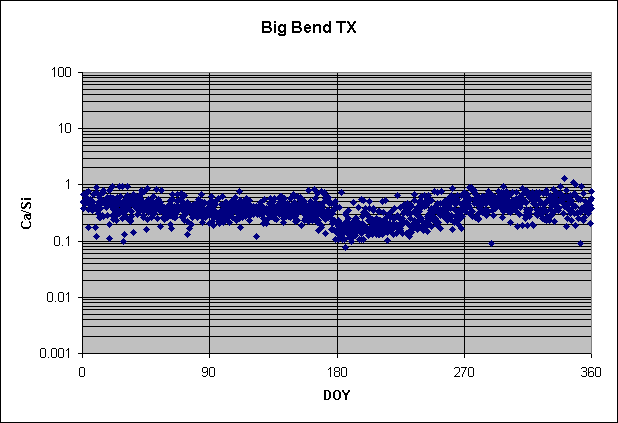
For comparison, I show Big Bend's plot for Si below. Note how much neater and cleaner the Saharan effect is for the ratio plot, even though it is larger in the Si plot. This make Ca/Si a very sensitive indicator of Saharan aerosol.
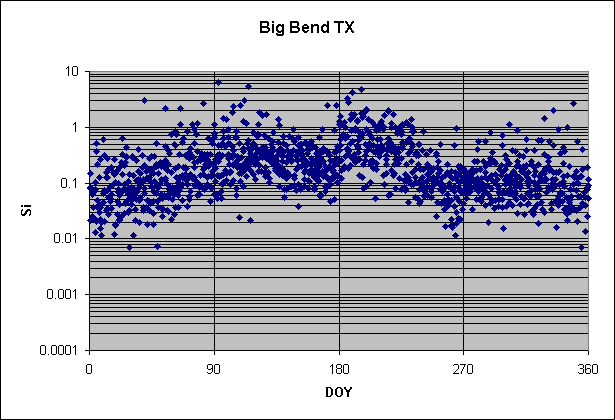
In summary, the Ca/Si ratio works together with the concentration of Si to show that the crustal aerosol of winter and early spring throughout the West is can be strongly influenced by transport from over the Pacific, maybe even dominantly. But it also shows that the summer crustal aerosol at the same places is dominated by local material. The ratio reveals that nonspring aerosol throughout most of the East has higher values than in spring, for reasons that are not yet clear. Lastly, the Ca/Si ratio provides a very sensitive test for the presence of Saharan aerosol throughout the Southeast, because it has lower ratios than North American sources.
Ahead to Ca/Si vs. Ca/Si at Mauna Loa
Back to Si vs. Si at Haleakala