The IMPROVE data on Si vs. Si at Haleakala
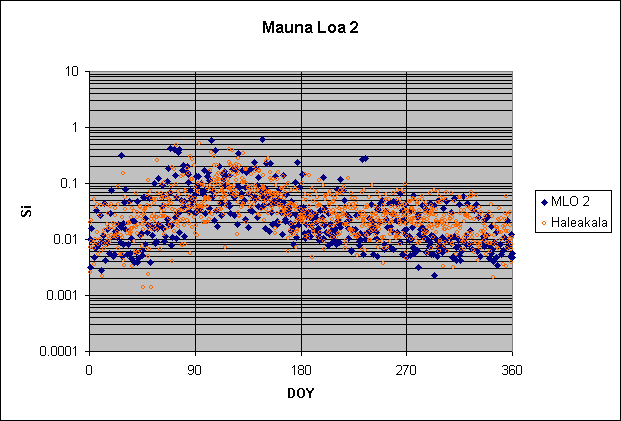
Since the point of this slide show is to compare concentrations and patterns for Si at various sites with those are the reference site of Haleakala, Hawaii, it first behooves us to take a close look at the pattern there. I will broaden that effort slightly to include Mauna Loa, the conventional reference site for Pacific aerosol coming toward North America. The plot of Si at both sites is shown below, with discussion following it.

It is obvious that the two patterns are very similar, each
with a low in winter, a big peak in spring, a rapid decline to intermediate
summer values, and a final decline back to winter values in December. The actual
concentrations for each season are more similar than different, as well, as is
the timing of the transition between the various seasons. Both sites show a big
split in concentration during late summer and fall, and to a lesser extent
during winter.
Another important characteristic, as yet unexplained, is the
asymmetry of the spring peak. It rises nearly twice as rapidly as it falls.
Specifically, it rises the full way during March and the first part of April
(six to seven weeks), but then takes half of May and all of June, July, and
August (14 weeks) to reach its "summer" values, particularly at Mauna
Loa. It is important to keep in mind this shape, the critical points f timing,
and the various concentrations when viewing the slides in this PowerPoint show.
The next question is how well Hawaii represents the aerosol
reaching North America. The skeptic would say that it does not, for Hawaii is
too far south (20° N, versus the 40° N to 50° N
where Pacific aerosol typically enters North America). But a careful look at the
plots of Si over western North America seen below shows that Hawaii does seem to
adequately represent the incoming aerosol. I'm not yet sure why it functions as
well as it does, however.
Now for the patterns of Si in the West and what they seem to
mean. As seen above for Pb, a few sites in the far Northwest (Washington) have
flatter patterns than Hawaii does. To the south and east, however, the patterns
quickly take on a characteristic shape that is seen with minor variations
throughout the West (from the coast through the Rockies). That pattern follows
the Hawaiian Si from winter through the spring peak, then decreases less rapidly
than at Hawaii, establishes summer values well above the Hawaiian, and then
decreases back to Hawaiian winter values around December. A typical such
pattern, for Lassan, in northern California, is shown below.

Note the stable summer values that are about
five times above the Hawaiian ones. Also note the rapid decrease in November
back to Hawaiian values in December. Finally, note the difference between the
up-side and the down-side of the spring peak, with the down-side falling off
less rapidly than in Hawaii. The simplest interpretation of the asymmetry is
that the up-side begins with transported Pacific aerosol but that local crustal
aerosol grows in during the rise and shows itself from the peak forward. The
local component strongly dominates during summer and then disappears abruptly in
November. Patterns similar to Lassen are seen throughout the West. I strongly
urge the reader to take the time to view all the western sites in this slide
show, and as many times as necessary to establish this fact.
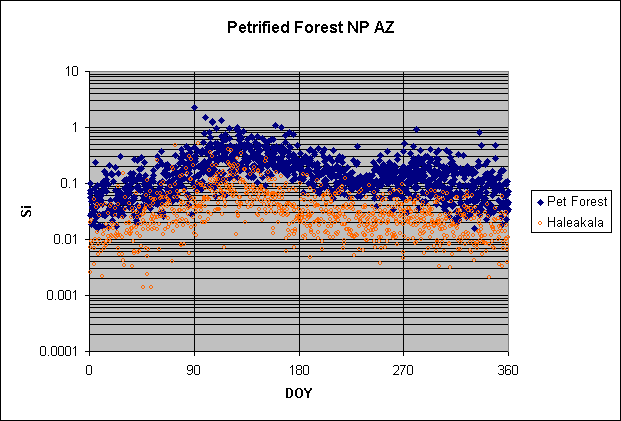
There is one interesting twist in the Southwest, however—concentrations
throughout the year lie above those in Hawaii. A good example of this is shown
below, for Petrified Forest, Arizona.

It is as though the pattern from farther north
is simply displaced upward by a factor of two or so. You can even see the same
separation of patterns during late spring and summer as at Lassen, only now they
are farther apart. I suspect that this upward shift is a very important
phenomenon, and exemplifies the difficult problem of separating local from
transported Si. Here is the problem in a nutshell. (1) Spring is the time that
aerosol from over the Pacific (both pollution and crustal) is transported most
efficiently to North America. That is shown by Pb, whose spring peak must
represent transport rather than emissions because Pb does not have a spring
maximum in China; it has a winter maximum and has dropped far down by this part
of spring. (2) Spring is also the time that some two-thirds of North America
shows a peak in fine-particle Si, whose simplest interpretation is that it comes
from nearby regional emissions. Thus we are not allowed to conclude from the
spring peak alone that a crustal aerosol represents Pacific sources. It seems
natural that the dusty Southwest would have higher crustal aerosol than the
more-northern part of the West, and that this aerosol would be mostly from this
region, especially during the windy spring. So the simplest interpretation of Si
at Petrified Forest (and other similar sites in the Southwest) is that it is
mostly or heavily local throughout the year. (We will try to check this idea in
the next section by using Ca/Si ratios.)
Another interesting feature of these slides is that they
remind us that quite a few sites in the East have some degree of spring peak
that coincides with the larges ones in Hawaii and the West. Although we noted in
the previous section that spring peaks were nearly absent in the East, we see
here that, although smaller, they can still be present. An example of this is
shown below, for Dolly Sods Creek Wilderness, West Virginia.

Note how closely the spring peak coincides with
the one in Haleakala, both in timing and in concentration. It is less prominent
than at Haleakala, however, because of the higher winter concentrations in West
Virginia, a characteristic feature of much of the East.
So is this peak at Dolly Sods caused by Pacific aerosol? That
seems to be quite a stretch, although it cannot be eliminated from this figure
alone.
Simpler is the explanation proposed for the spring peaks in the Southwest, that
they are just a local effect of the high spring winds. After all, it is only
during the spring that concentrations at Dolly Sods match those in Hawaii. Plots
similar to Dolly Sods are seen throughout the upper Northeast, and would
presumably have the same explanation.
One very difficult and unsettling plot is that for Denali,
Alaska, at the foot of Mt. McKinley. Even through Denali lies at about 63°
N, close to the Arctic Circle, its plot for Si is virtually identical in all
seasons to Hawaii's. (See plot below.)

How to explain this striking and unexpected (at
least by me) similarity? I see three possibilities: (1) Denali's aerosol is
controlled by the same Asian sources that set Hawaii's aerosol. (2) Denali and
Hawaii are both controlled by "northern" air and its aerosol, and
neither specifically reflects Asian aerosol. (3) Denali and Hawaii both reflect
aged Northern Hemispheric aerosol from widely mixed sources, even those sources
need not be the same for each. The first of these possibilities can be
eliminated immediately because Denali gets large doses of Arctic aerosol in
winter and spring, as shown mainly by its S. (See slide show for S below.) This
makes Denali's explanation broader than pure Asian, and strongly implies that
Hawaii's must be broader, too. But whether that broader explanation is
possibility 2 or 3 remains to be seen.
In summary, the plots of Si vs. Si at Haleakala have shown
that Si follows the Si of Hawaii most closely during winter and spring in the
upper half of the West. In summer at those places the concentrations are higher,
and probably come from local sources. Farther into the Southwest, concentrations
are higher throughout the year, and may well come from local sources. Much of
the East has a spring peak of sorts, which is probably also local, although
Pacific sources cannot be eliminated by Si data alone. Denali, Alaska, near the
Arctic Circle, has Si with a pattern that is virtually identical to Hawaii's,
for reasons that are not yet clear but probably imply a broader interpretation
for Hawaii's Si.