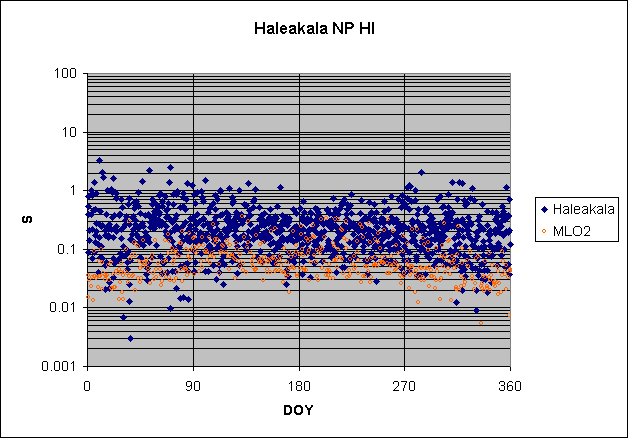
IMPROVE data on S vs. S at Mauna Loa
This page and the associate PowerPoint show compare the
concentrations of S in the United States (with emphasis on the West) with the
incoming concentrations over the Pacific. I chose Mauna Loa over Haleakala
because Haleakala seemed to have too many interferences with S (higher
concentrations), particularly in seasons other than spring. I decided that
getting the proper seasonal balance overrode the lower concentrations at Mauna
Loa. So viewers of these plots have to mentally raise the concentrations of S by
a factor of two or so in order to bring them to the likely values actually
reaching the western U.S. The need for this will be evident from the individual
plots, and is addressed below.
Just to be clear at the outset about the relations between S
at Mauna Loa and Haleakala, here they both are on a single plot. Only Mauna Loa
displays the seasonal pattern characteristic of most of the other elements at
these two sites, namely a maximum in spring and a gentle falloff toward summer
and fall.

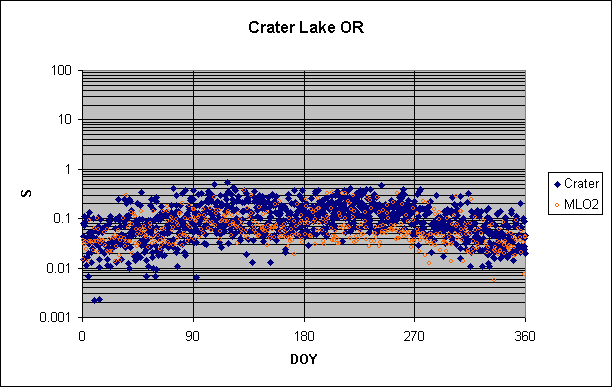
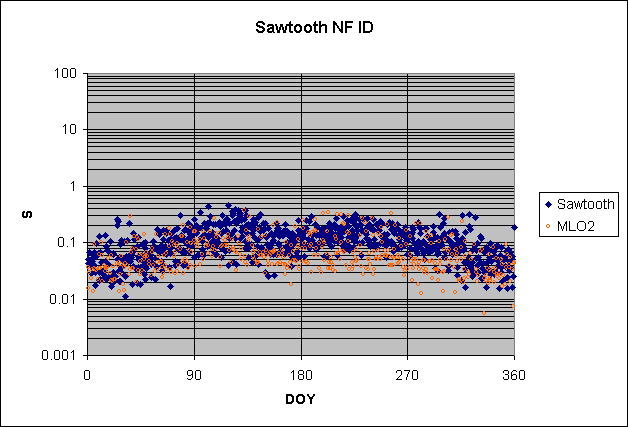
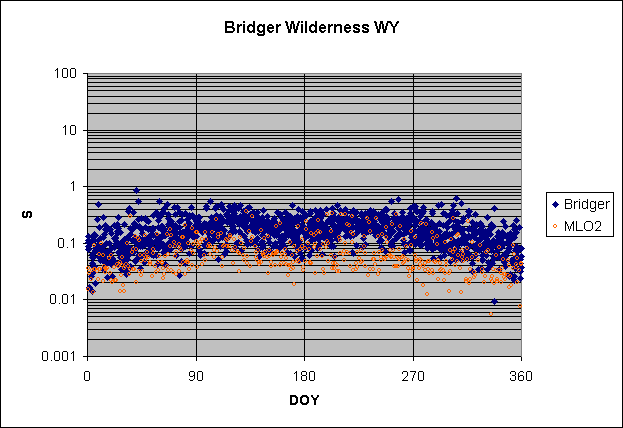
You can see that the spring peak for S at Mauna Loa is in the range of 0.2 to 0.3 µg m-3. Does a peak with the same timing and double the concentration appear in the American West? It surely does. as shown by the four representative plots below, for Crater Lake, Oregon, Sawtooth National Forest, Idaho, Bridger Wilderness, Wyoming, and Mt. Zirkel Wilderness, Colorado. Each has peaks of the same size at the same time.

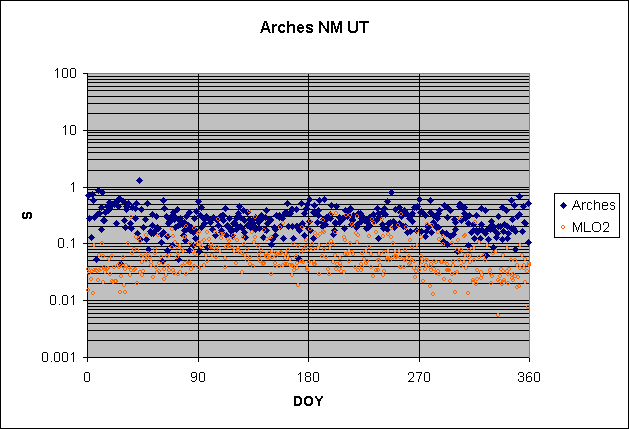
Based on the broader distributions of spring peaks for Pb and Zn in the West, there is no reason to expect them not to be present for S. Several additional sites have shoulders on their plots during spring, or simply unusually tight concentrations of points, probably indicating a peak mostly masked by a higher background. Here is one case where the spring points are unusually concentrated, particularly on the bottom, for Arches National Monument, Utah.
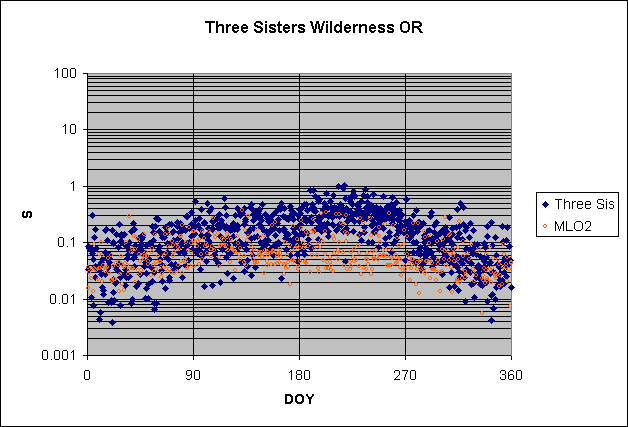
Here is a case with a shoulder in spring, Three Sisters Wilderness, Oregon.
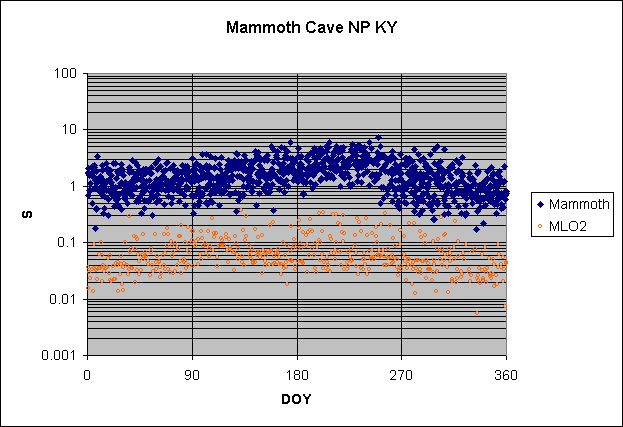
But east of the Rockies, the backgrounds of S increase to the point where they obscure any spring peak from the Pacific. A good example is Mammoth Cave National Park, Kentucky:
Perhaps the strongest evidence for aerosol coming down from the Arctic during winter is seen by noting a spring peak that is earlier than in the West but in perfect synchrony with Alaska. Such peaks are seen along the northern fringe of the U.S. One of the best examples is Voyageurs al Park, Minnesota:
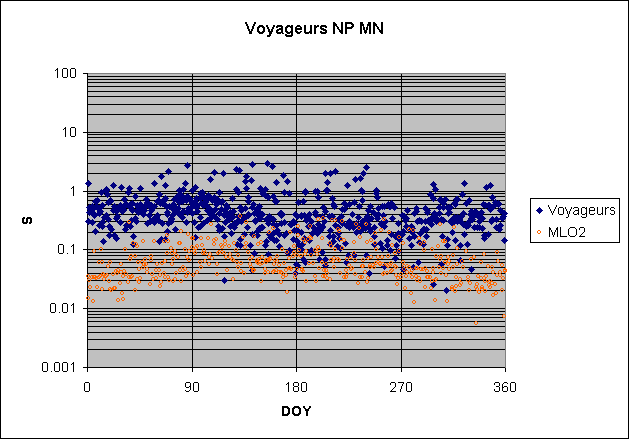
The peak at Voyageurs is stronger and earlier by a few weeks than the one at Mauna Loa. But it matches or exceeds the one in Denali, Alaska, at the foot of Mt. McKinley:
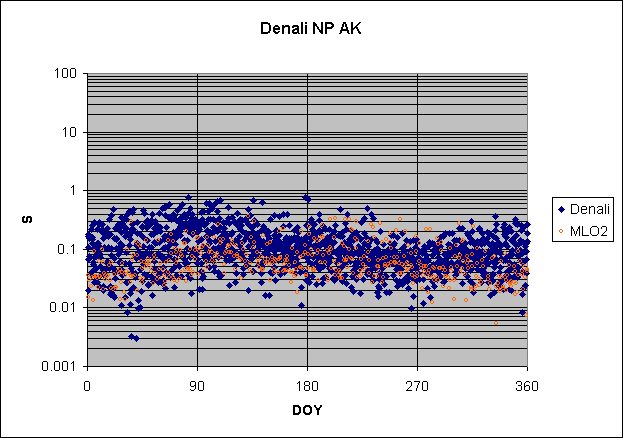
Concentrations of S at Voyageurs could exceed those at Denali because
Voyageurs is closer to the main pathway for polluted air out of the Arctic,
which is southeastward out of Alaska and the NWT to the east of the Rockies.
In summary, a spring peak of S appears throughout much of the
West, with timing and concentrations that are consistent with the spring peak at
Mauna Loa. That means that this western peak has probably come from over the
Pacific. A stronger, earlier spring peak is seen across the northern edge of the
U.S. It is consistent in timing and nearly consistent in concentration with a
peak at Denali that probably represents Arctic haze. Both these peaks are masked
by the higher background concentrations east of the Rockies, however.