Plots For The Crime-Scene Fragments
Unlike the previous two groups of fragments
considered here (the twelve quarter-bullets and the fourteen test bullets), the
six crime-scene fragments generally do not need log-log plots to reveal their
correlations. Like those groups, however, they reveal no meaningful correlations to
confirm the predictions from the metallurgical argument. The crime-scene
fragments are especially important to this argument because they contain
order-of-magnitude smaller fragments, where the boundary effects in lead
crystals should stand out the best. If they are not seen here, they aren't a
factor. They are not seen here.
As before, we present comments on each scatter plot directly
beneath it.

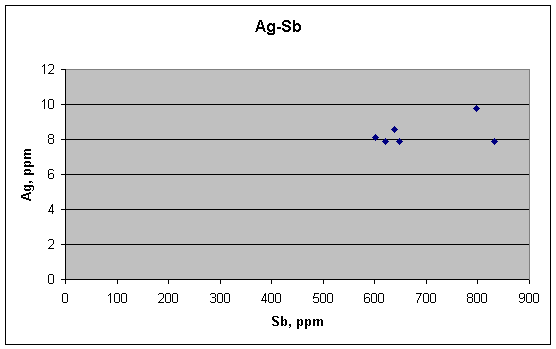
There is no correlation between Ag and Sb in these fragments, and there should not be, according to the metallurgical ideas. That does not prove these ideas are right, however—that would require a positive link where there is supposed to be one.
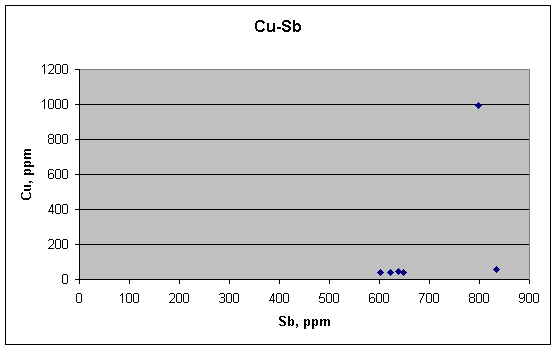
This is where there is supposed to be a positive link—between
Cu and Sb, each of which are known to be enriched at the boundaries of lead
crystals. Instead, we see one high outlier for Cu above a nearly flat background
for the other five samples.
Thus it would seem at first glance that Cu and Sb are not
correlated in these samples, either. The grain-boundary explanation would
then be refuted for all three sets of samples. But we must bend over backward to
be fair here, for it is a critical point in evaluating the metallurgical
hypothesis.
A closer look shows that the low background for Cu might
actually be rising a bit as Sb rises. But are the two effects proportional, and
if so, are they meaningful? To check further, we try a log-log plot for Cu and
Sb. It puts a slightly different cast on the data, as shown below.
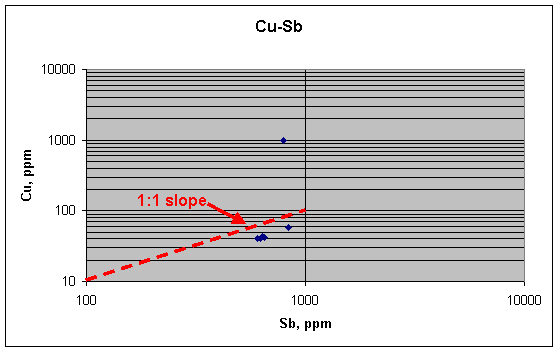
This plot suggests that Cu and Sb in the five "background" fragments might be related linearly, with each element ranging over about 50% in concentration (40–60 ppm for Cu, for example). An expanded view of the plot confirms this idea:
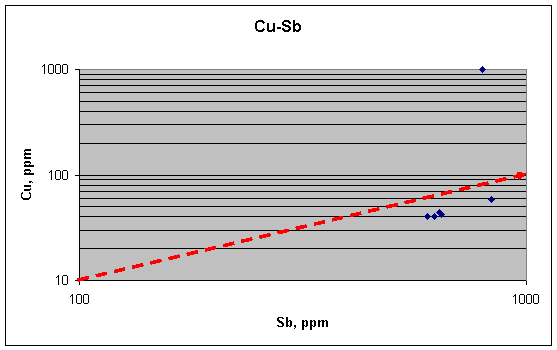
But is this relation
significant? Are we to view it as confirming the grain-boundary
explanation? Here we must put things into perspective. First, consider the scale
of variation represented by these fragments. In this plot Cu and Sb are covarying over a factor of 1.5 in
concentration, and with one out of six samples being an extreme outlier. In the
14 background bullets they ranged over factors of 10 and 100, respectively, and
were so noisy that no trend could be found, especially in the positive sense. In
the 12 quarter-bullet samples, Cu and Sb ranged over factors of 20 and 5,
respectively, mainly owing to two high outliers for Cu, and no trend could be
seen in the remaining ten samples. Second, the Cu in the two high-Sb samples
here probably cannot be taken seriously because the extreme outlier is also in
this group. Without the high group, the Cu and Sb vary by only 10%, and no
conclusions can be drawn from that.
Thus considering everything, none of the three groups of
samples are consistent with the metallurgical explanation for Cu and Ag.
We can only conclude that something else is controlling their concentrations.
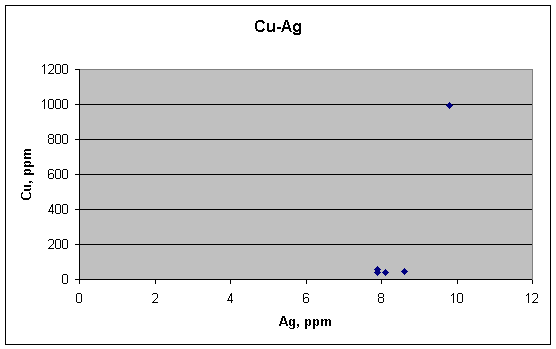
There is no correlation between Cu and Ag, as would be expected from their behavior in lead.
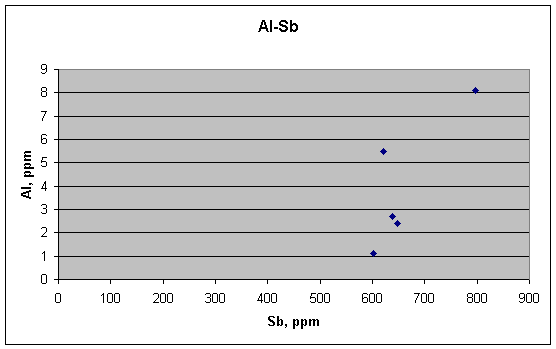
For completeness, I have included plots for Al, Mn, Na, and Cl, the other elements that Guinn measured in the assassination fragments. The first of these, for Al vs. Sb, shows a shape that night be envisioned as a reasonable positive correlation between the two. It is not clear whether it carries any meaning, however.
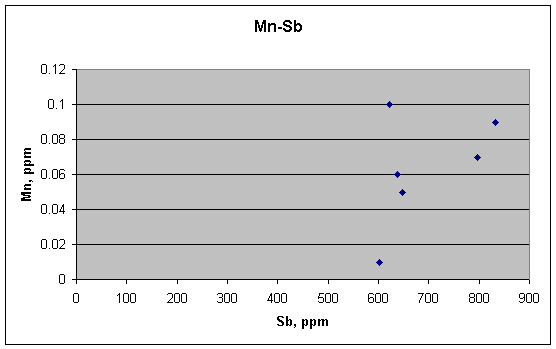
Mn and Sb are not related, however.
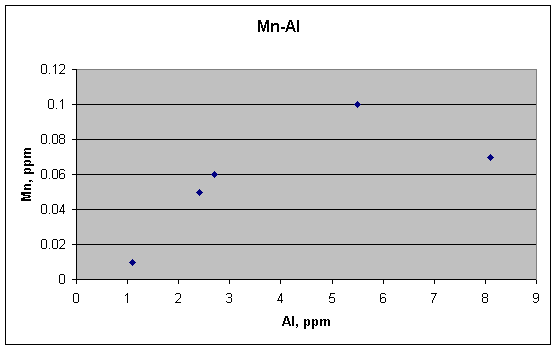
Mn and Al could be viewed as being correlated, however, except for the outlier with the highest Al.
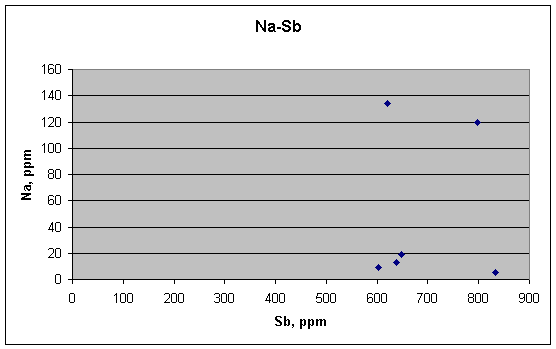
Na and Sb are not correlated,
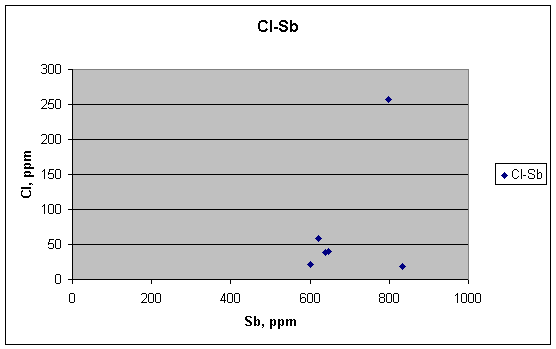
… nor are Cl and Sb.
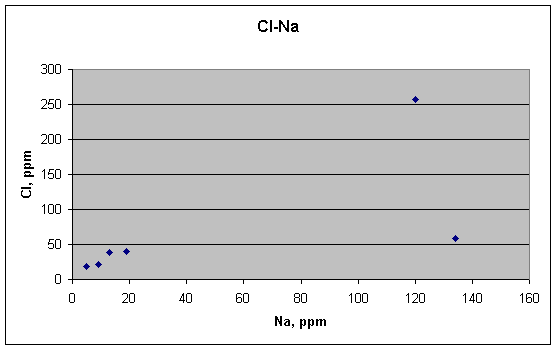
Cl and Na might be correlated, however, depending again on how one views the two high outliers for Na. Each would make its own slope for the plot. The most reasonable interpretation of this plot, however, is probably that Cl and Na are not correlated.