Lack Of Correlation Between The Three Elements
This paper shows that Cu and Sb are segregated at the boundaries
of lead crystals. If this effect controls
their concentrations in samples of WCC/MC lead, as the paper claims both for the
JFK crime-scene fragments and the comparison samples, then
Cu and Sb ought to show correlations with
each other in all these sets of samples. In samples with more boundaries, both
Cu and Sb should be enriched. In samples that come more from the center of
crystals, the Cu and Sb should have lower concentrations. (The correlations need
not be linear, however, or even precisely reproducible. But correlations must be
found in order for Randich and Grant's explanations to be true.) But no such
correlations are found. We demonstrate this critical fact by using plots from the
quarter-bullet analyses, the fourteen "background" bullets, and the
crime-scene fragments.
The rest of this page shows the quarter-bullet data. The
plots for the background bullets and the crime-scene fragments are shown on
separate pages.
Background bullets
Crime-scene fragments
The quarter-bullet analyses
The data for Guinn's quarter-bullet analyses of one
bullet from each of three lots of WCC/MC ammunition come from Table II-C (Appendix F) of his report to the HSCA. The three scatter plots
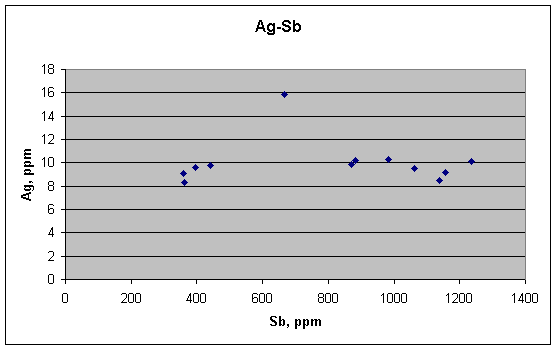
for Sb, Ag, and Cu against one another are shown below. They reveal clearly that
none of these elements correlate with the others. Comments are underneath
each of the plots.

In this scatter plot of silver (Ag) against antimony (Sb), note how uncorrelated they are, as the article's metallurgical theory predicts. There is no trend to the concentrations, and the one high value of silver clearly shows up as an outlier. But lack of correlation for elements predicted to not correlate is not strong evidence for a theory. Much stronger would be a correlation between elements predicted to correlate. To look for that, we turn to Cu vs. Sb.
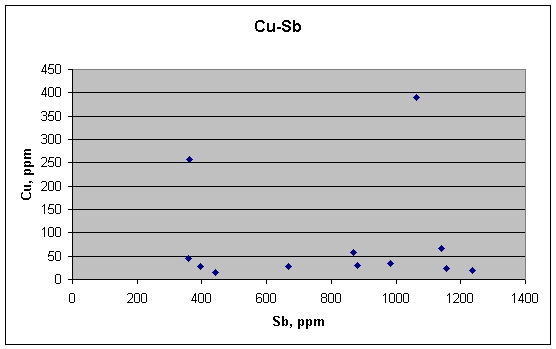
This is the plot that is supposed to show a good correlation—Cu vs. Sb. But it doesn't. There is no relation between Cu and Sb. If the concentrations of each element were being controlled by segregation at the boundaries of crystals, as the article strongly implies, their concentrations ought to be at least weakly correlated, but they are not. Antimony varies smoothly over a wide range, whereas copper remains nearly constant (in the same samples), except for two big outliers. Thus the metallurgical explanation fails for the twelve quarter-bullet samples. Such segregation may happen in individual grains, but it doesn't translate to the fragments of the quarter-bullet analyses.
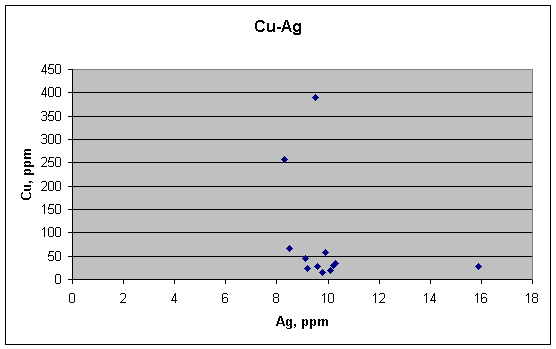
Even if Cu and Ag don't correlate with Sb, they might
correlate with each other, and perhaps inversely. But this scatter plot shows that they do not.
We must therefore conclude that none of these three elements
in the quarter-bullet samples are being
controlled by systematic segregation at the boundaries of grains.
Log-log plots
The different concentration scales of elements in scatter
plots can sometimes make the plots tricky to interpret fully. For example, if a
high outlier squeezes the other points near the bottom of the plot (as in Cu vs.
Sb above), a meaningful trend in the low points may be difficult to spot. These
problems can be remedied by using log-log plots instead, where each axis is
logarithmic instead of linear. Relative to linear plots, they compress the high
end and expand the low end.
Log-log plots also display log-normal
distributions better. This is important for environmental studies because many environmental variables are
distributed more closely to log-normal than to normal (Gaussian). It is also
germane to bullet-lead studies because many elements in many bullet leads are distributed
nearly log-normally,
as for example the all-important antimony in WCC/MC lead. Log-normal
distributions are created, among other ways, when materials with different
starting concentrations of a constituent are mixed to variable degrees, as they
usually are in nature. Thus it came as no surprise when we found a log-normal
distribution for WCC/MC lead, because we knew that it was a mixture of virgin
lead and various scrap leads, including previous batches of bullets with higher
antimony.
Log-log plots have two important shapes: direct and inverse.
A direct linear (first-power) relationship between two variables, expressed as Y
= aX, shows up like this on a log-log plot. The upper line is Y = X (i.e., a =
1). The lower line is Y = 0.3X (a = 0.3).
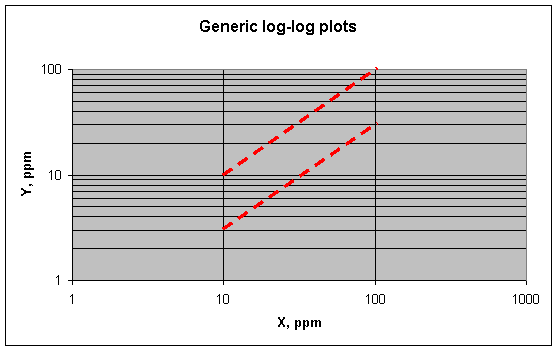
This is the kind of plot we would expect for two elements that are both equally concentrated at the boundaries between lead crystals If element Y is less concentrated there (proportionately, of course), the plot would be flatter. If Y is more concentrated, it would be steeper. (Recall that the article states that Cu and Sb are concentrated at these boundaries.) What does a perfectly flat plot mean, where element X varies over a wide range while elements Y does not vary at all (as shown below)?
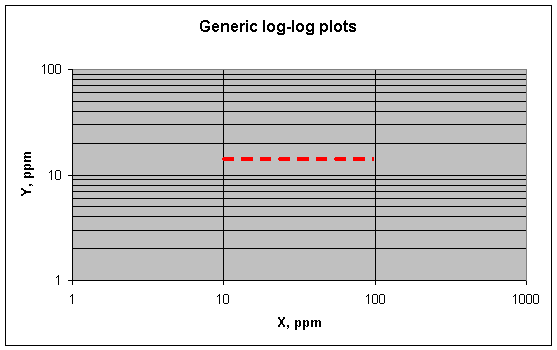
The most obvious interpretation would be that X is
concentrated a lot at the grain boundaries while Y is not. But it could also
mean that both X and Y are concentrated at the boundaries, but that X has
another source of variation that far outweighs its boundary-concentration
effect. How to choose between these explanations? If you know that X and Y get
strongly concentrated at the boundaries, for example, the flat plot would
strongly imply that another source of variation is controlling X. In other
words, the correlation between X and Y caused by concentration at the boundaries
is being masked by the much larger variations of X from the other source.
An inverse variation between X and Y (Y = 1/X) appears on
log-log plots as a slope of -1. An example is shown below.
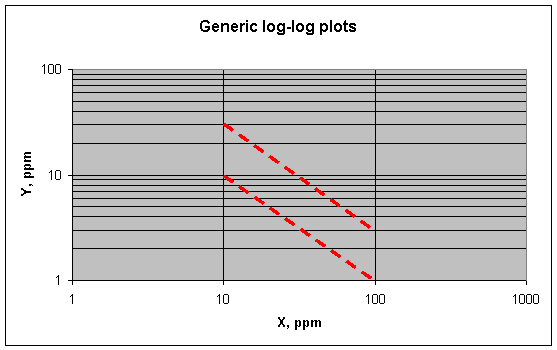
Here the upper line represents Y = 300/X, the lower line Y =
100/X. An inverse relation like this would be expected of elements in lead when
one decreases while the other increases. (Here Y is decreasing while X is
increasing.) What would make one element increase while the other decreases?
This might happen if one element was concentrated at the grain boundaries, while
another was not concentrated there at all (i.e., was depleted or absent in the
material at the boundaries). So an inverse relation between two elements in a set
of lead fragments would mean that only one of the elements was being
concentrated at the boundaries. But as far as I can see, an inverse plot alone
cannot tell which element is being concentrated at the boundaries and which is
being depleted there (i.e., concentrated at the center of the crystals).
So we have three main types of log-log plots. A positive
slope means that both elements have similar sources of variation, either from
variations within grains or from some larger-scale cause. (The first of these
was implied for Cu and Sb in the article.) A zero slope (flat plot) means that one
element has a strong source of variation relative to the other one, over and
above any weaker sources of covariation that might be present. A negative slope
means that one element increases while the other decreases, which could have
grain-scale causes or larger-scale causes.
Log-log plots for the quarter-bullet data
To give the fairest possible interpretation to the
quarter-bullet data, I have also plotted them in log-log format. Comments are
below each plot. Recall that the metallurgical argument predicted that Cu and Sb would be
concentrated at the grain boundaries, whereas Ag would be only slightly
concentrated there.
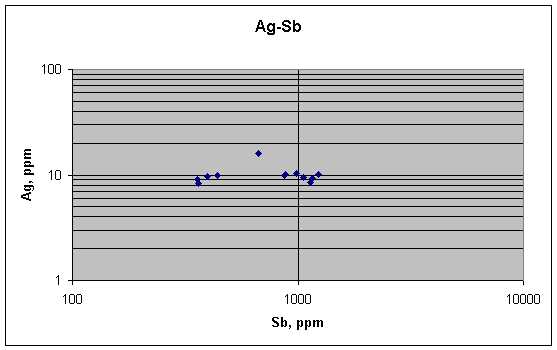
This plot shows no correlation between silver and antimony, as predicted by metallurgy. Antimony varies by a lot (proportionately), silver only by a little. Ag has a single positive outlier, but other than that, the graph is flat.
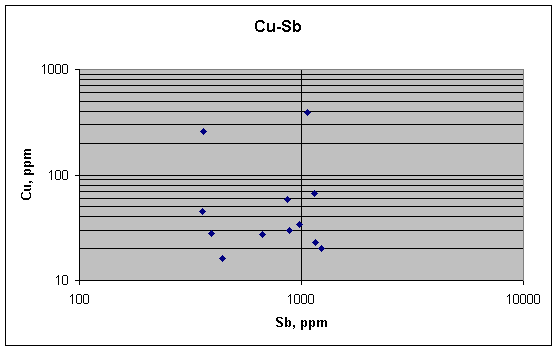
Copper and antimony, which both should be strongly concentrated at grain boundaries and so result in a positive correlation, do not show it in these samples. There may be a slight positive link between copper and antimony, but the data are too noisy to allow us to tell for sure.
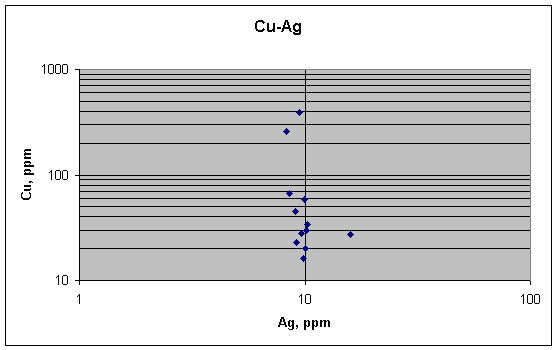
No link between copper and silver, as predicted by
the metallurgical argument. Copper varies much
more than silver does.
Thus the log-log plots confirm the findings from the linear
plots—there are no meaningful correlations between antimony, silver, and
copper in the quarter-bullet samples. The metallurgical explanation fails for the
these samples.