Plots For The Fourteen Background Bullets
Even if Cu and Sb were not correlated in the quarter-bullet fragments, they might be correlated in the fourteen background bullets, which are a much larger sample whose elemental concentrations vary over larger ranges as well. Remember that we are looking for positive correlations between Cu and Sb, as the metallurgical explanation had predicted must be present, but no correlations between silver and antimony or copper. The linear plots are shown first, then the log-lot plots.

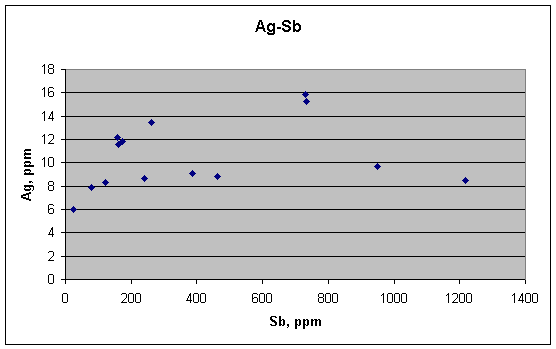
This plot shows hints of a small positive correlation between silver and antimony at low concentrations, but nothing at the high end (which would represent the boundaries between grains). The latter observation would be in accord with the metallurgical predictions.
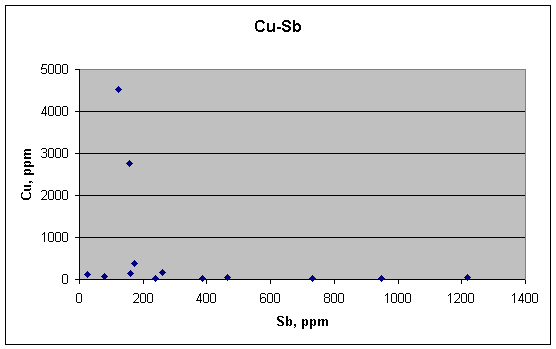
Excluding the outliers, copper and antimony may show a slight negative correlation at low concentrations (the opposite of the metallurgical predictions), but little or nothing at the high end (also opposite to the metallurgical predictions).
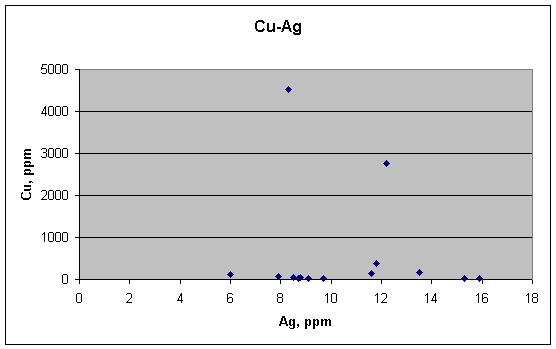
Excluding the two obvious outliers, there seems to be no correlation between copper and silver (as predicted by the metallurgy).
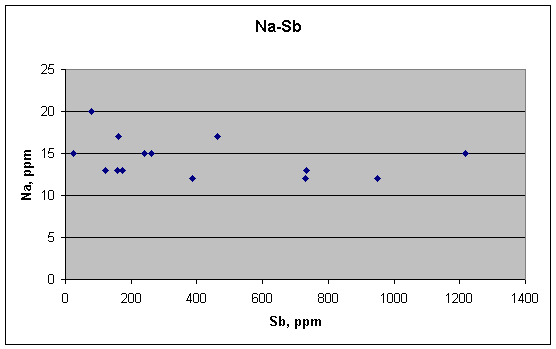
The plot of sodium vs. antimony is very interesting because neither element has outliers that would hide the basic shape. It looks as though they are negatively correlated at low concentrations, but only slightly. But again the basic result is lack of correlation.
Log-lot plots
We have also constructed log-log plots for these 14 samples,
mainly to better examine possible trends at low concentrations. Comments are
given underneath each plot.
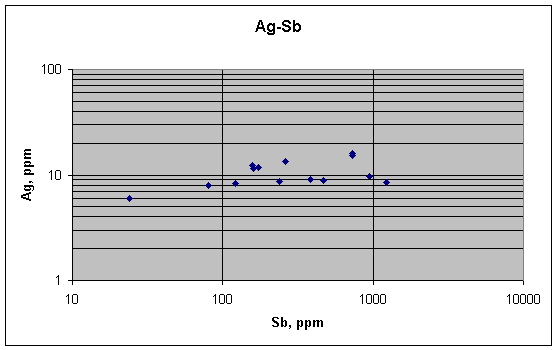
There is little or no correlation between Ag and Sb, as expected from their properties in lead. There may be a slight positive correlation at low concentrations, but nothing in the rest of the plot.
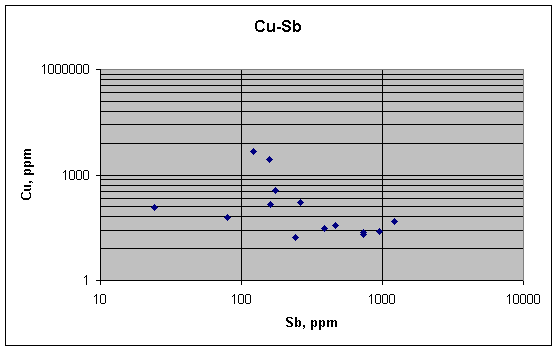
The plot of Cu vs. Sb remains noisy, with little or no apparent trend. Cu has two or three upper outliers. Excluding them, there seems to be either a flat plot or a slight inverse trend at low concentrations. But neither of these things are the positive correlation that is predicted from the metallurgical explanation of grain-boundary effects. Since we know that they are concentrated at these boundaries, something else must explain the variations of these elements in the 14 samples.
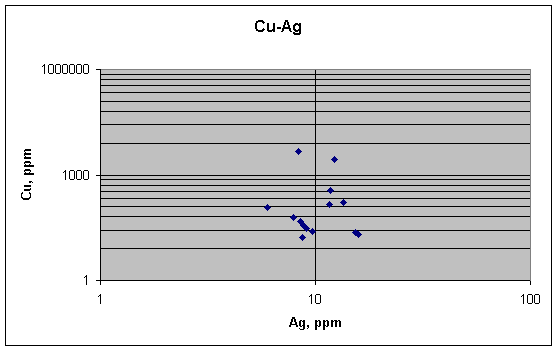
No correlations between Cu and Ag, just noise.
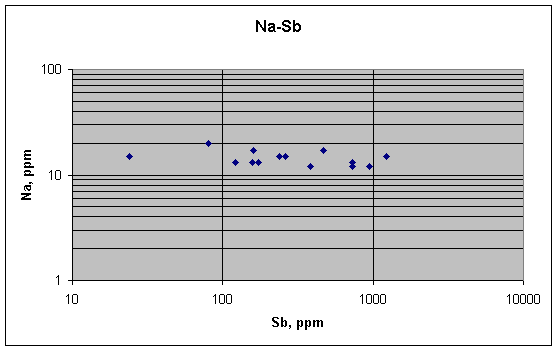
This is the only plot to show anything like a systematic correlation, and it is a slight negative trend for Na with increasing Sb.
Summary of the 14 test bullets
The 14 test bullets do not show the positive correlations
between Cu and Sb expected if both are concentrated at the edges of grains and
the samples are small enough to pick up varying degrees of this effect. Instead,
they show order-of-magnitude greater variations of Sb than Cu and no discernible
trend. The only
reasonable conclusion from this is that the variations of Sb are being
controlled by something other than the factor controlling the Cu. If Cu is
controlled by grain-size variations, then Sb is not. If Cu is controlled by some
other factor, then anything could be controlling the Sb.
In short, the 14 test bullets provide no evidence that
grain-size variations are controlling Cu or Sb there. They refute the
metallurgical
explanation, just as the quarter-bullets did. The metallurgical
explanation is now 0 for 2. But maybe these samples, of 50 grams, are too big to
show a grain-size effect. To evaluate this possibility, we can turn to the
crime-scene fragments, some of which are as light as 5 grams.